
Budget
Are we projecting income and expenses appropriately compared with similar clubs?
 Sector benchmarking for social and sports clubs.
ClubMetriks turns your club's data into sector references so you can compare, understand your performance and make better decisions.
Presentations are scheduled through WhatsApp.
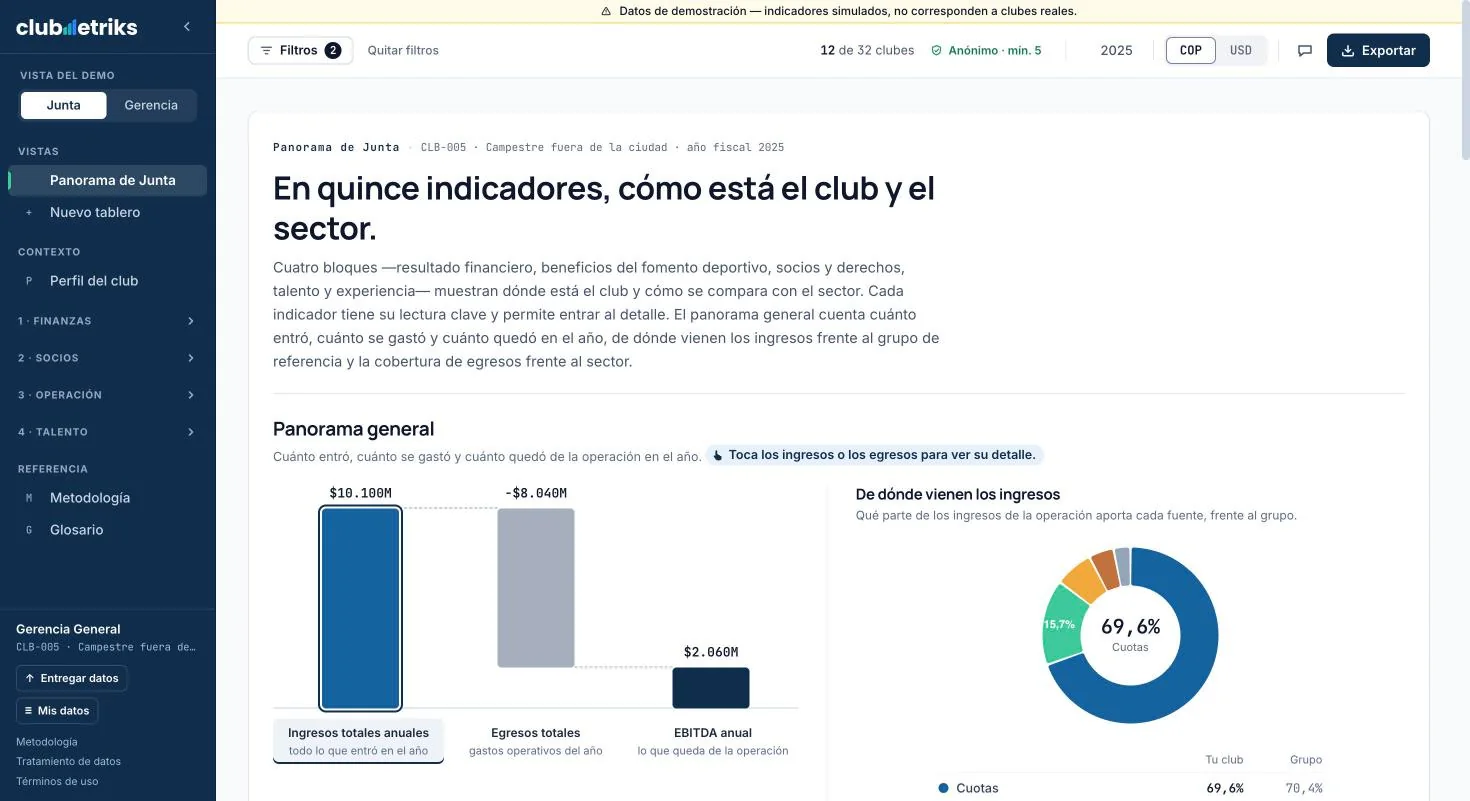
EBITDA margin, club by club n = 12
Your club: 20.4%. Group average: 15.5%. Each column is a club in the group, unidentified.
Real ClubMetriks screen, in Spanish, with demo data: simulated indicators that do not correspond to real clubs.
Clubs have information about their income, expenses, members, services, staff and investments. But one fundamental question often goes unanswered:
How do we compare with similar clubs?
Club EBITDA margin
20.4%
Is that good?
The same figure, against the sector · 32 clubs
3.9 points above the sector average (16.5%) and within the typical range, which runs from 10.3% to 23.5%. Now the figure says something.
For each indicator, ClubMetriks puts your figure against two averages. They answer different questions.
EBITDA margin of the same club, against each reference
Against its group, the club is 4.9 points above. Against the sector, 3.9 points above. The same figure reads differently depending on who it is compared with, which is why the platform shows both.
Are we projecting income and expenses appropriately compared with similar clubs?
Are our rates, membership rights and occupancy levels in line with the market?
How do we know whether our investments and operating costs make sense compared with other clubs?
Are our staffing structure and its costs comparable with those of similar organizations?
Conversations between peers help, but every club measures differently. ClubMetriks lets you build a common reference.
It's not only about knowing how your club is doing. It's about knowing how it compares with similar clubs.
ClubMetriks is a platform for comparing your club's performance with that of other similar clubs, using a consistent methodology and more than 100 sector indicators.
A deep view of financial, operational and organizational performance.
At least five clubs per group. Filters by club type and by services.
One data-collection cycle a year, one to two hours per area lead. Formulas and criteria are published.
The whole club, not just its finances.
Structural characteristics, size, members, membership rights and services.
Who are you being compared with?7 indicators
From Essential
Income, operating expenses, results, liquidity, investment and reserves.
Is the club sustainable?51 indicators
From Essential
Memberships, rights, occupancy, profile, experience and usage.
Do members join, stay and feel happy?23 indicators
From Essential
Sports, services, food, beverages, events and facility utilization.
How well does each service work?14 indicators
From Management
Organizational structure, staffing, productivity, work climate and human talent costs.
What team does the club run with, and at what cost?14 indicators
From Management. Key salaries by position on Strategic
An executive view of the club's performance that makes it possible to understand the results of each management dimension and to put the relevant information at the center of strategic conversations.
Fifteen indicators in four blocks: financial results, sports development benefits, members and rights, and talent and experience.
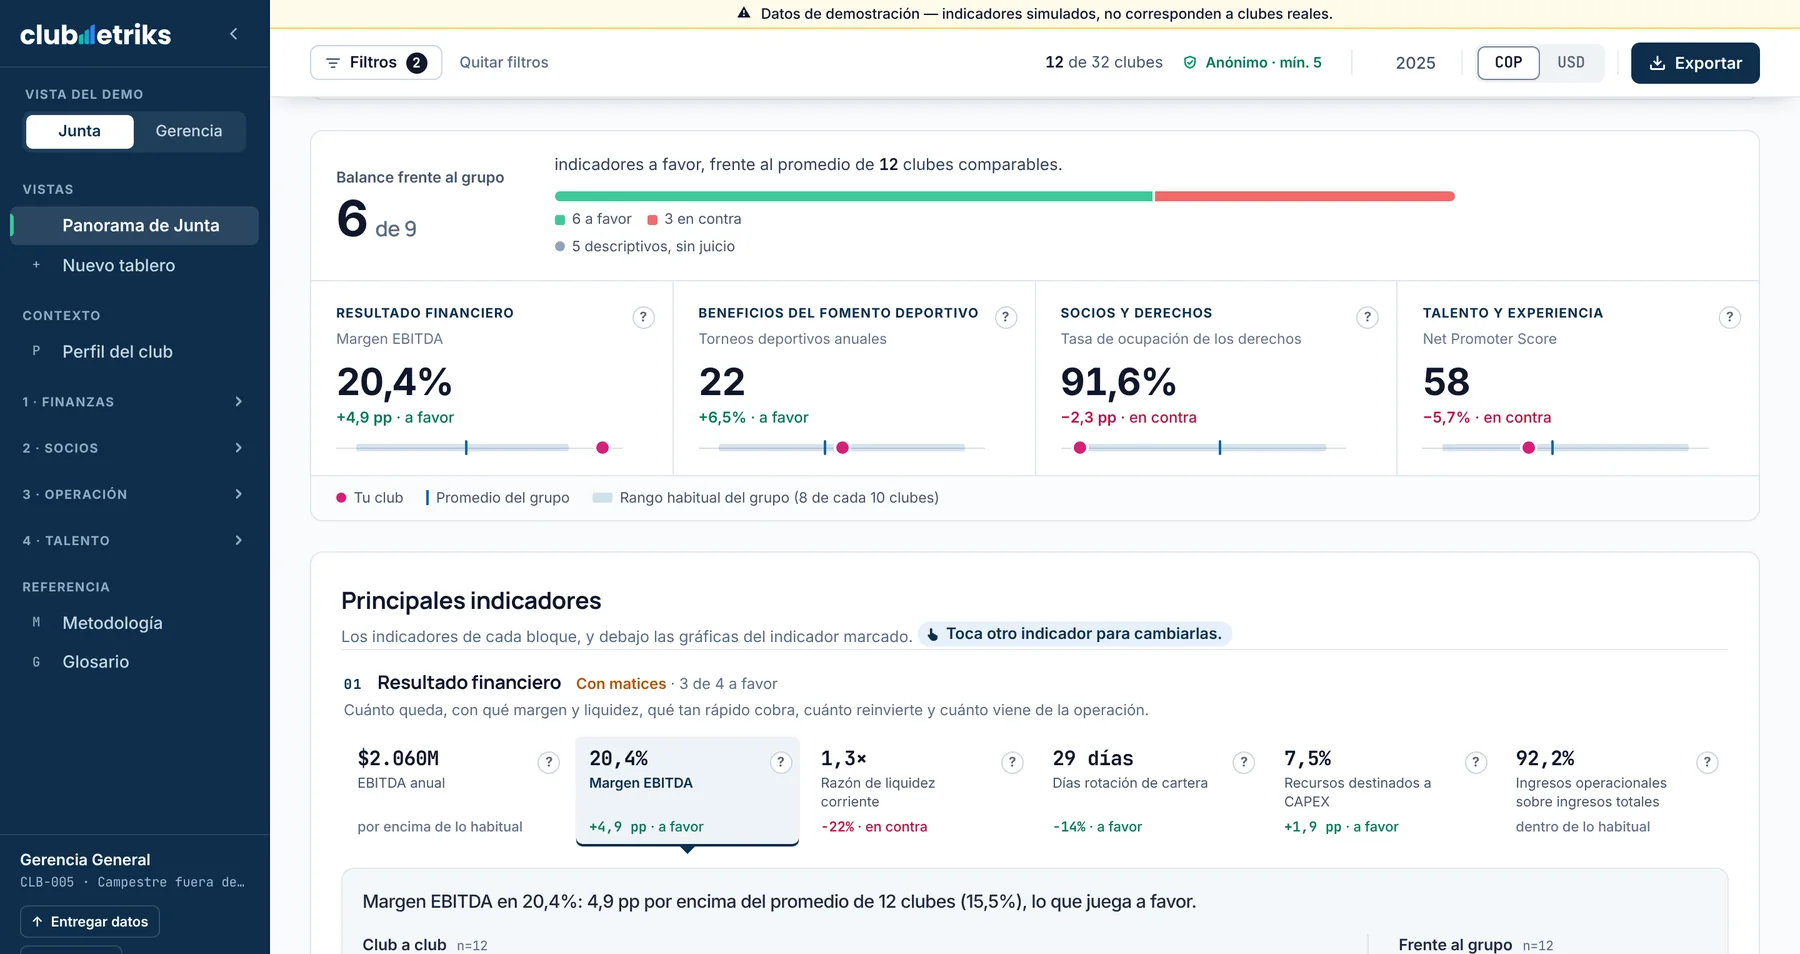
The year's balance: how many indicators work in favor and how many against, compared with the group.
Four blocks, each with its key indicator and the block's status.
Your club, the group average and its typical range on the same line.
Each indicator says in one sentence what its figure means, ready for the meeting.
What works against you shows in red, so you can start the conversation there.
Real Board overview screen, in Spanish, with demo data: simulated indicators that do not correspond to real clubs.
A reading of the club that makes sense in a single meeting.
Schedule a presentationAn environment designed so that club leadership can analyze its performance with clear sector references.
A view of the main indicators, their results and opportunities for improvement.
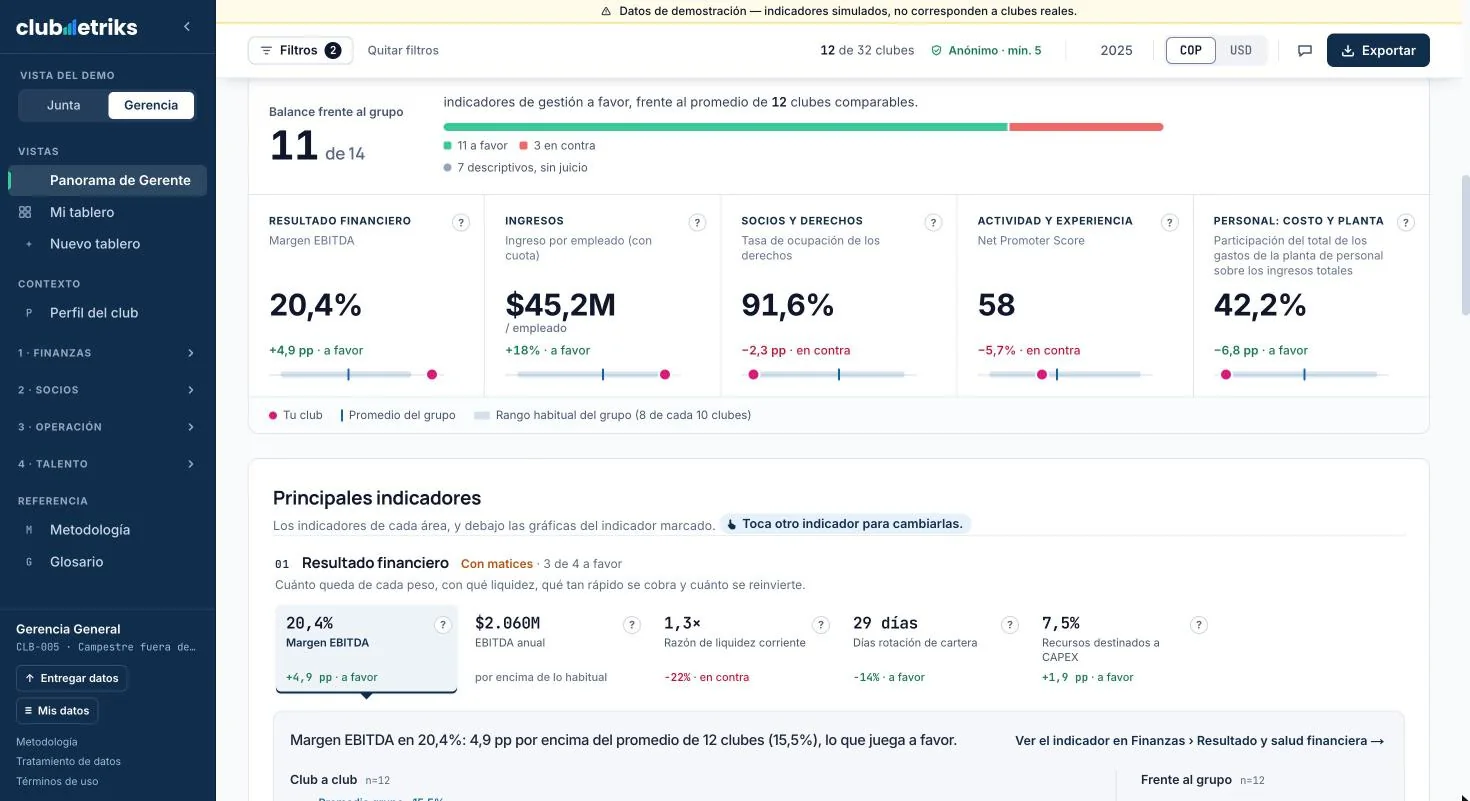
Each club can build its own dashboard with the indicators and charts it considers most relevant.
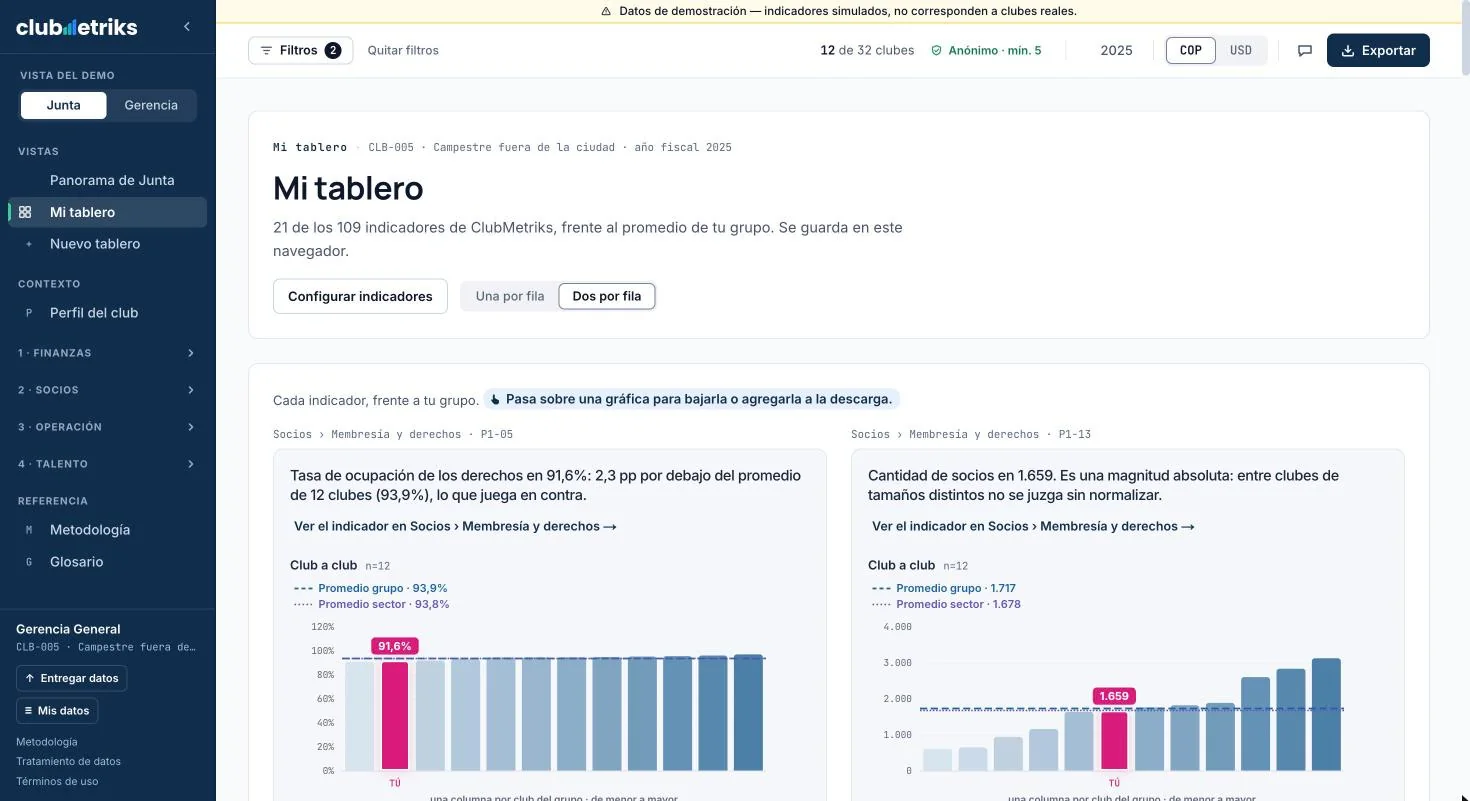
Anonymous club-by-club visualization, and comparison against the group average.
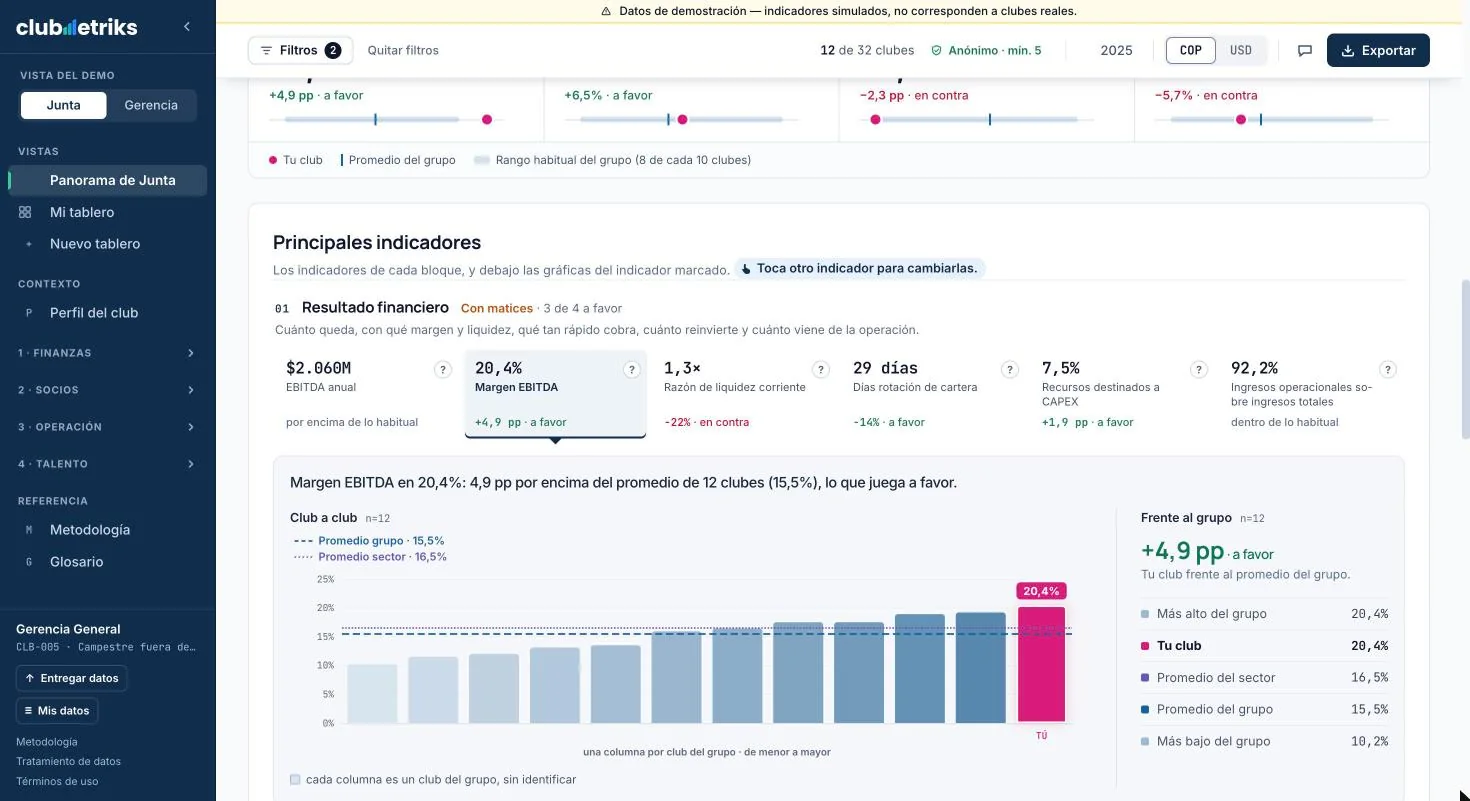
Each indicator shows its definition, formula, sources, the group's typical range and a reading of the result.
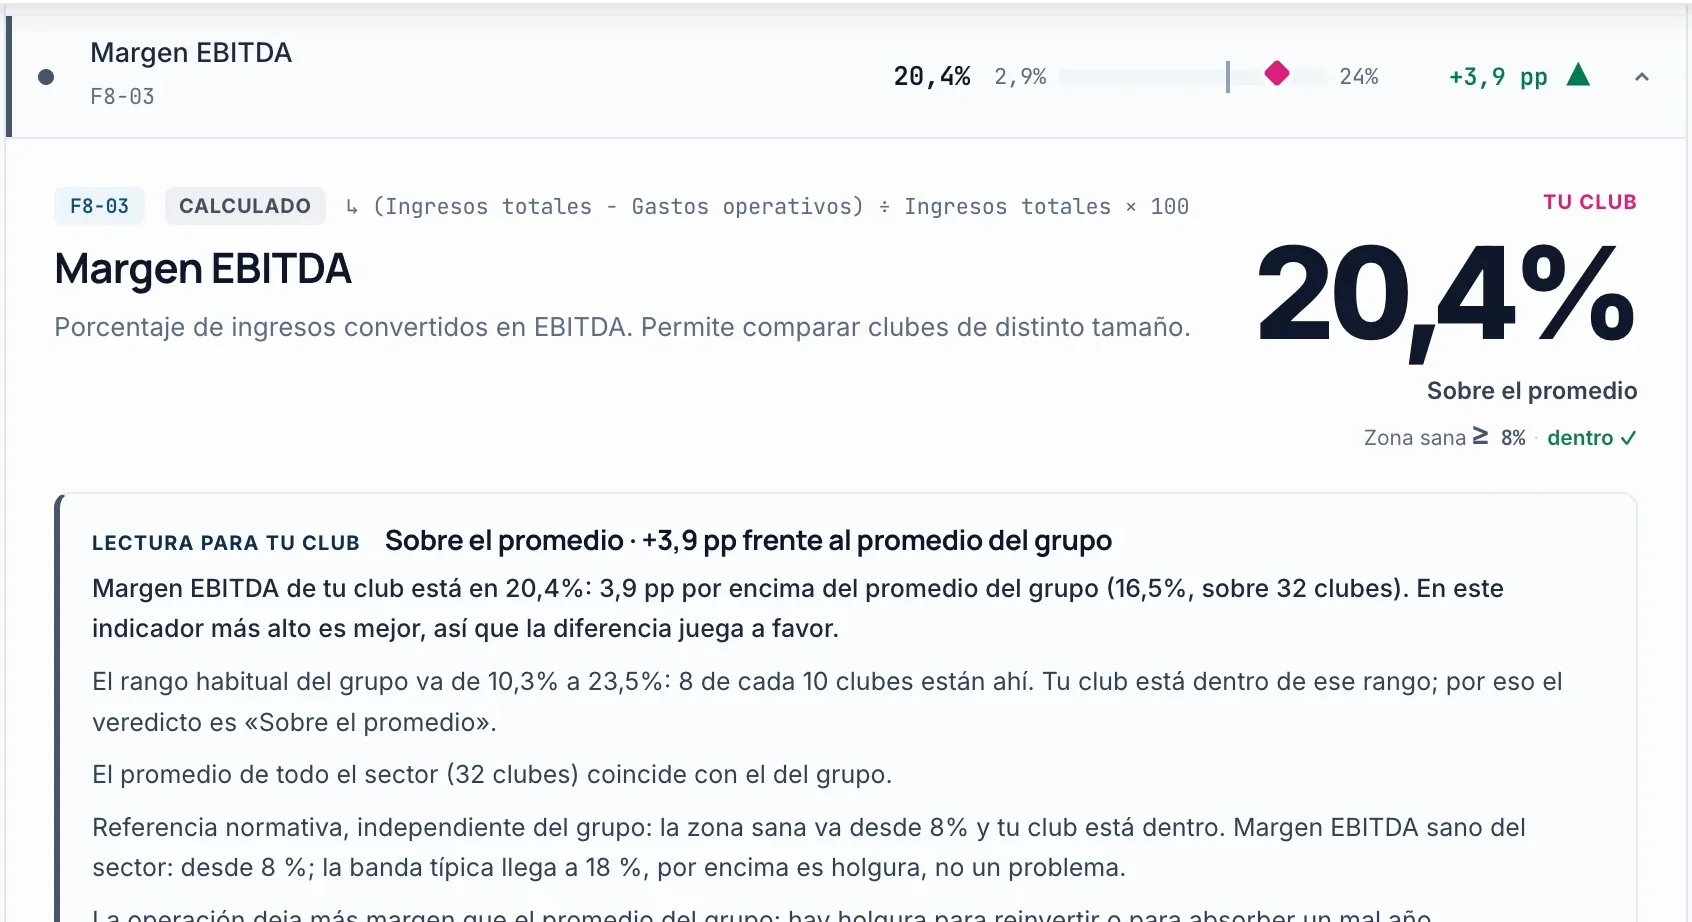
Download images of the indicators and full reports for your presentations and meetings.
Available on the Management and Strategic plans.
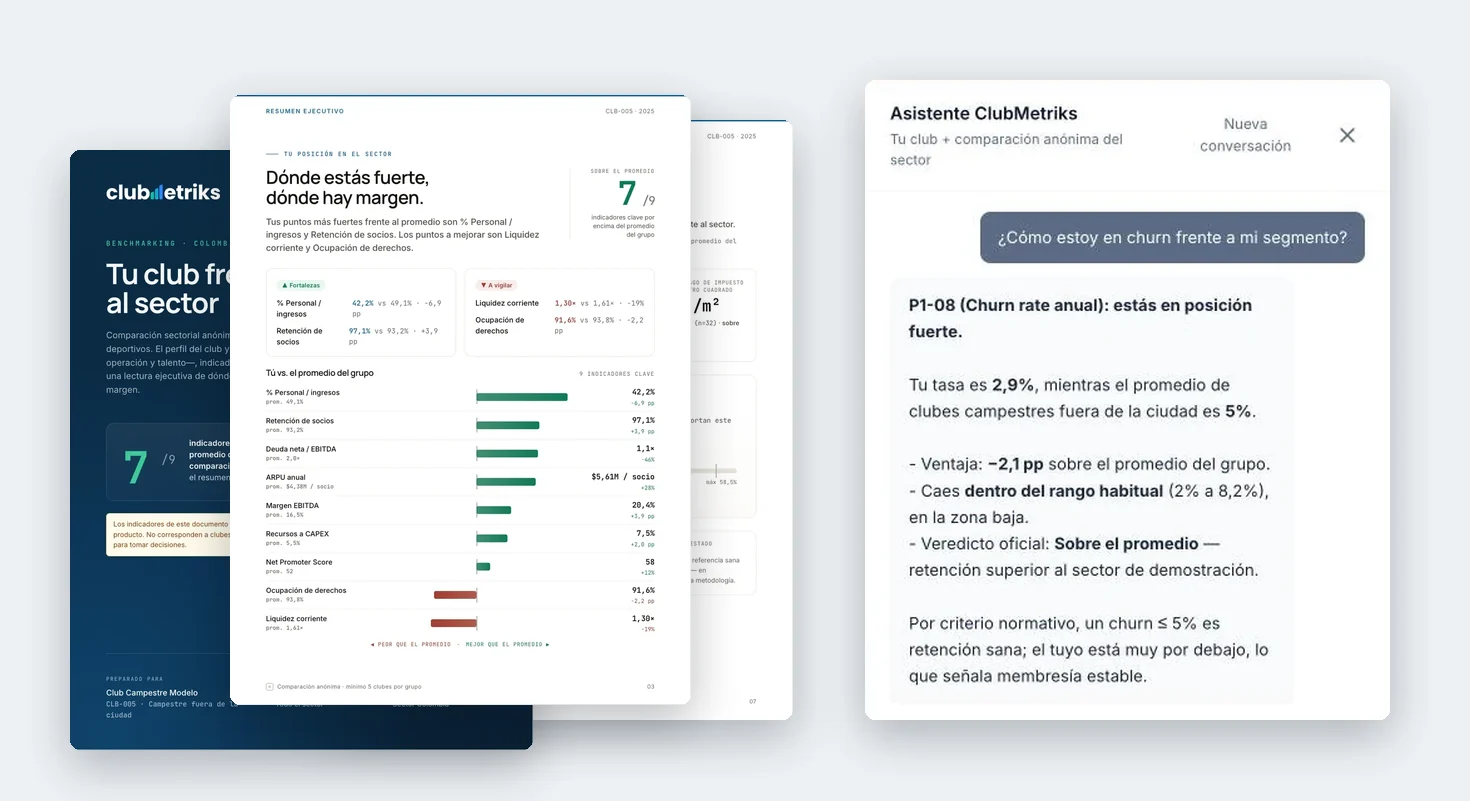
The best way to understand it is to walk through it in a guided presentation.
A useful comparison only works when clubs trust the methodology and the way their information is handled.
What your club sees of its group · example with six clubs
A comparison is not published if the group has fewer than five clubs. If a filter brings it below that, the app blocks the combination and tells you.
Each club sees its own name and its own data. Other clubs appear without a name or identifying code. ClubMetriks staff only look at a club's figures with a reason that is recorded.
Each club sees the comparison for the indicators it has submitted. If a data point is missing, the indicators that depend on it are not shown.
Data is reviewed to check that it is complete and consistent before results are published.
Do you have questions about how information is handled? We'll answer them with you in the presentation.
Schedule a presentationIt's not about adding a permanent administrative burden, but about making use of the information your club already generates.
Distributes the information collection among the leaders of each area.
1 to 2 hoursper year
Each lead spends roughly one to two hours a year providing their information.
We check that the information is complete and consistent. If something doesn't add up, you are told before anything is published.
You access your indicators and compare them with the clubs in your group.
To find out where your club stands.
COP 6.4 millionUS$1,850
COP · annual fee, before VATUSD · annual fee, before VAT
One-time registration fee: COP 3.2 millionUS$925
Includes operations, talent and AI
To understand how your club operates and how its talent is made up.
COP 10.8 millionUS$3,150
COP · annual fee, before VATUSD · annual fee, before VAT
One-time registration fee: COP 5.4 millionUS$1,575
To compare talent by position and have greater analytical capacity.
COP 14.2 millionUS$4,150
COP · annual fee, before VATUSD · annual fee, before VAT
One-time registration fee: COP 7.1 millionUS$2,075
Not sure which plan your club needs? We'll go over it with you in the presentation.
Schedule a presentationAnother question? We'll answer it with you in the presentation.
A sector benchmarking platform for social and sports clubs in Ibero-America. It calculates 109 indicators with the same methodology for every club and shows where yours stands against comparable clubs, by club type and by services, in your currency or in dollars.
It is not club management software: it doesn't run daily operations, accounting or member relations.
No, it complements them. ClubMetriks uses information the club already produces —the closing figures of its fiscal year— and turns it into references for decision-making.
We ask for base variables, not already-calculated indicators: each club applies its own accounting policies and the sector calculation is the same for everyone.
Your club sees its name and its own indicators. No other club sees your figures or your name: they reach the sector without your name or your code, as averages, ranges and as one more anonymous column in the club-by-club charts.
ClubMetriks staff only look at a club's figures with a stated reason, and every access is recorded in a log.
In the presentation we go over these rules with you and how they apply to your club's data.
With rules the platform always applies: no comparative figure is published if fewer than five clubs are behind it, and other clubs appear with no name or code.
If a filter would leave the group below five clubs, or if comparing two cuts would let someone deduce one club's figure, the app blocks the combination and tells you.
It is the rule that protects each club: with smaller groups it would be easier to deduce one club's figure.
That is why, when a group has fewer than five clubs, the comparison is not published, and in the filters you will see notices like “protects one club”.
One to two hours a year per area lead. The general manager assigns the collection and each lead delivers their part in the form, which is the same Excel as always, with one sheet per chapter.
The platform checks that the information is complete and consistent, and flags anything to correct before publishing.
109 indicators across five dimensions: club profile, finance, members, operations and talent. Each one comes with its definition, formula, sources, the group's typical range and a reading of the result.
The plan defines the scope: Essential includes club profile, finance and members; Management adds operations and talent; Strategic adds the comparison of key salaries by position.
By the question your club needs to answer. Essential: where your club stands. Management: how it operates and how its talent is made up, with images, reports and AI analysis. Strategic: how talent compares by position, with greater analytical capacity.
All are annual contracts with unlimited users. In the presentation we go over which one fits your club.
Collection is annual, using the figures of the closed fiscal year. The first measurement uses 2025 data from clubs registered by December 31, 2026, delivered before January 31, 2027.
The next annual measurement, with the 2026 close, is planned for April 2027.
Find out how ClubMetriks can help you understand your performance against similar clubs and make decisions with more perspective.